Your research question determines the tool. We develop custom applications and deliver commissioned analyses for companies, insurers and research institutions at the intersection of psychology, data and AI.
TECHNICAL IMPLEMENTATION IN PRACTICE
AI analysis in action.
Emotion recognition & synchrony · ARTE
Broadcast on ARTE, this demonstration shows AI-based facial expression analysis and the temporal coordination of emotional expression between two people.
An annotated interview with Robert Downey Jr. illustrates how AI can analyse facial expressions and the temporal dynamics of a conflictual interaction.
Demonstration: automated classifications do not establish the emotions, intentions or personality of the people shown.
Movement analysis with AI
Using the example of gait analysis AI-based pose detection shows how body positions can be captured and movement sequences visualised. These time series make video data accessible for quantitative movement analysis.
Technical demonstration of gait analysis. The linked study examines movement synchrony in psychotherapy; it does not validate this gait analysis method.
Complex data workflows & research software
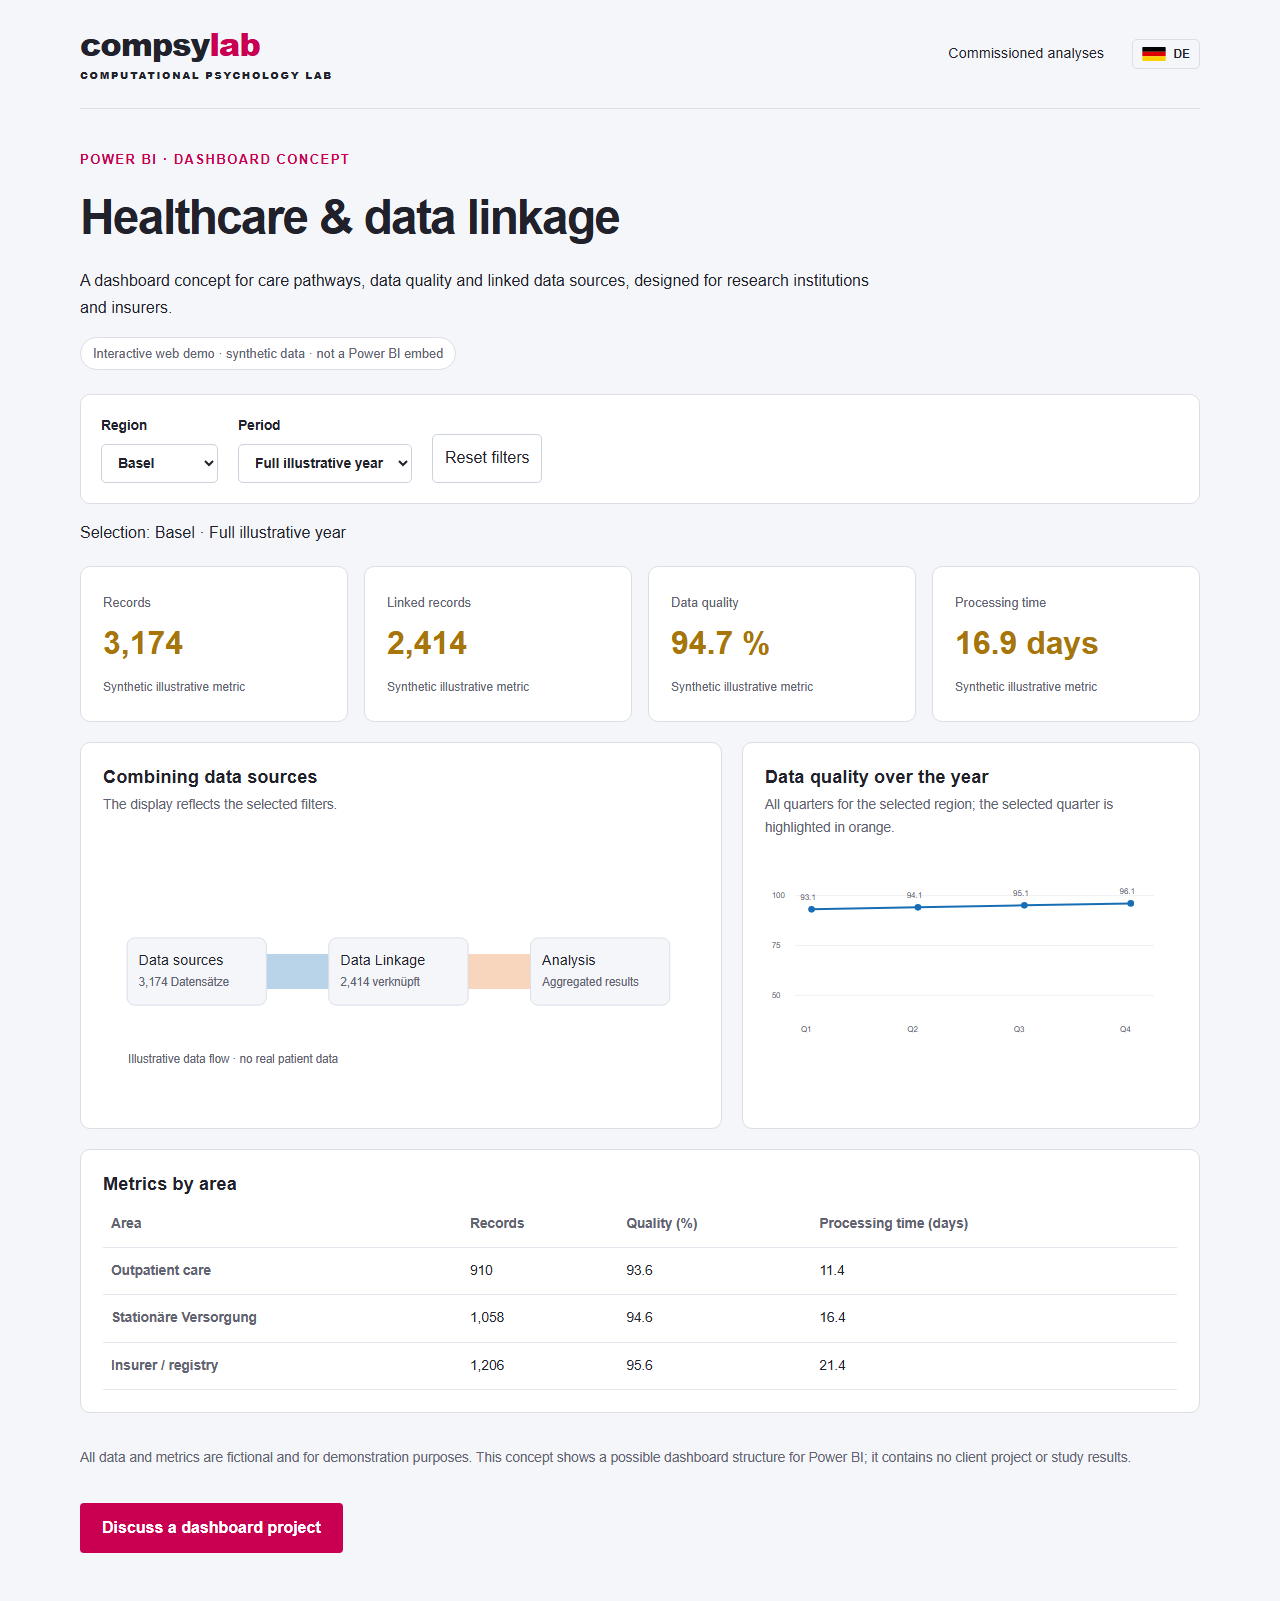
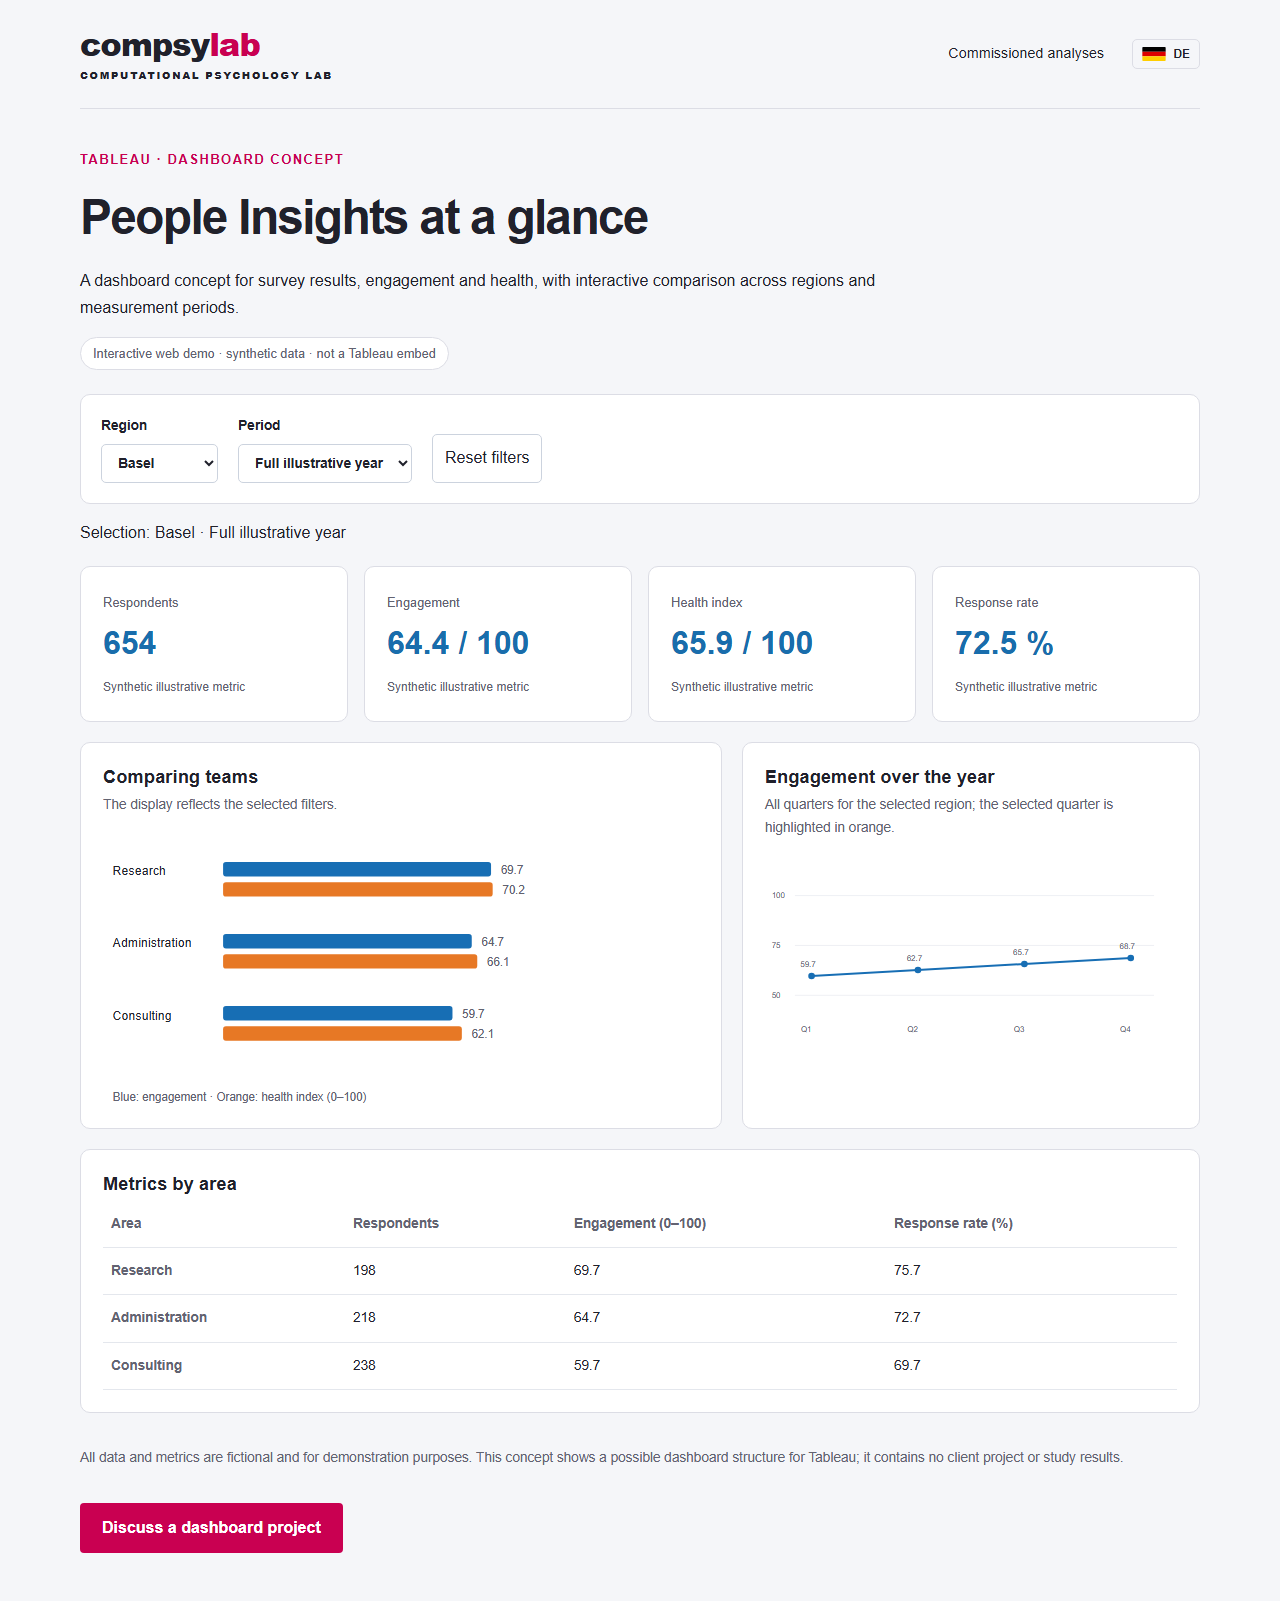
Online calculators, interactive dashboards and cryptographic data linkage designs: we implement complex analytical workflows and technical privacy requirements, from data integration to presentation of findings.
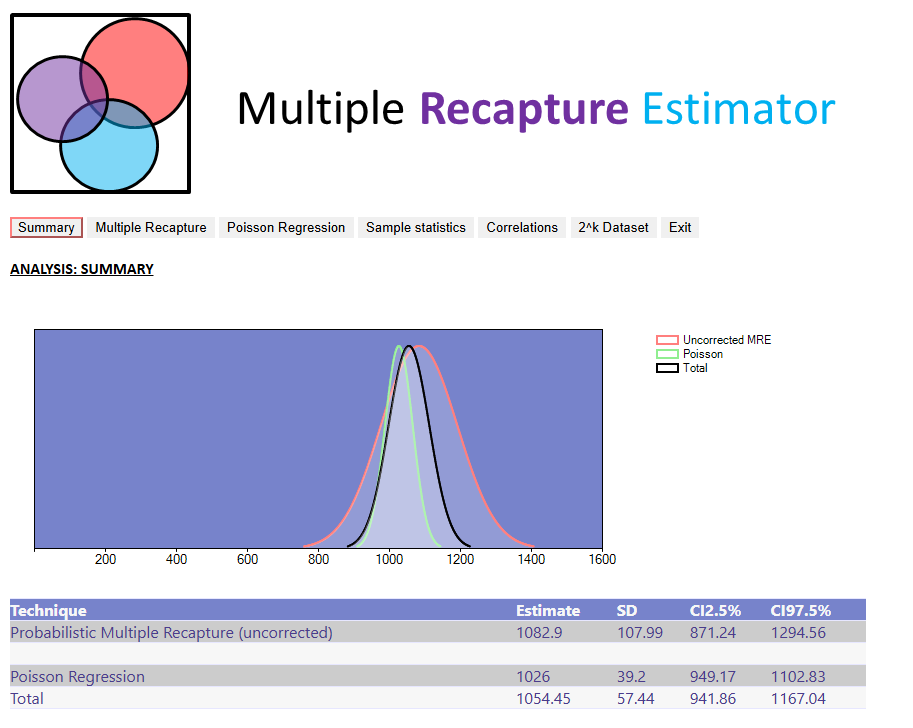
One implemented example is our Multiple Recapture Estimator: a web-based calculator for estimating population sizes from multiple data sources.
Web applications for surveys, assessments and study workflows, from data collection to structured data delivery.
Commissioned analyses
We handle data preparation, statistical modelling and psychometric evaluation for your project. You receive clear findings, expert interpretation and documented analytical steps.
AI & prototypes
Prototypes for text analysis, matching and other research applications of AI, with evaluation of output quality and documented limitations.
A particular focus of my work is the privacy-compliant implementation of complex studies and designs, especially involving multiple data holders (data linkage).
I have also worked extensively with sciCORE, the University of Basel's high-performance computing infrastructure. This experience of scientific computing on an HPC cluster complements my work on data-intensive research projects.
In these three studies, I personally implemented the cryptographic data linkage solutions, including software development and the technical integration of sensitive research data.
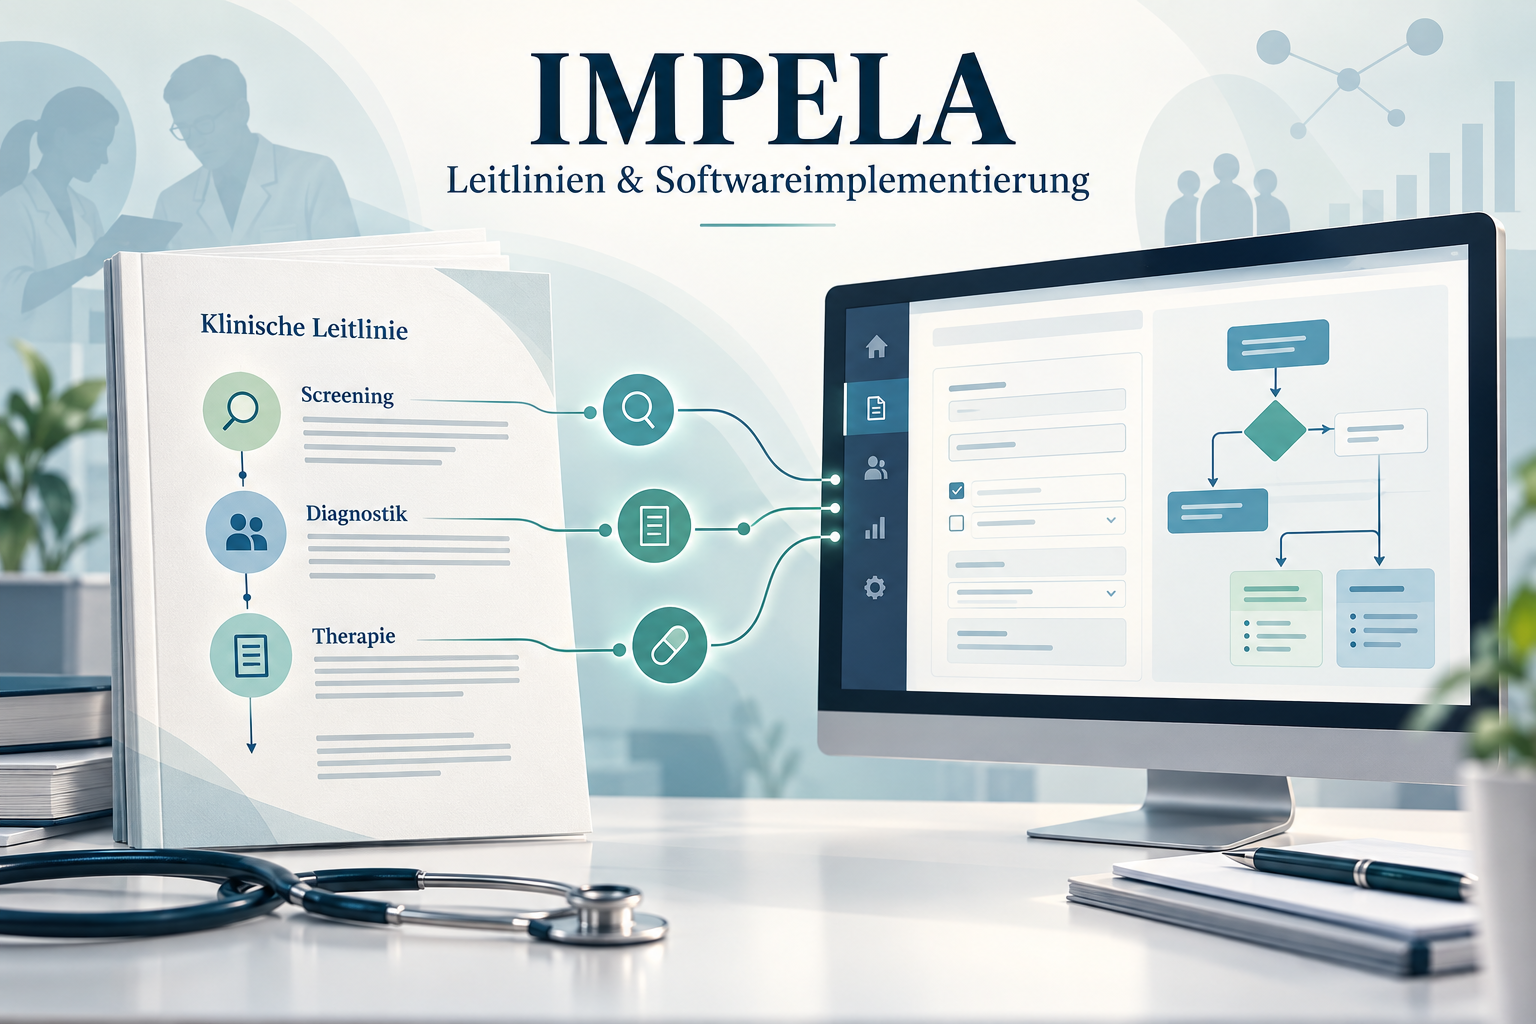
Implementation and evaluation of the S3 guideline for screening, diagnosis and treatment of alcohol-related disorders.
My cryptographic implementation: Development of custom software and cryptographic data linkage infrastructure for securely combining sensitive research data, in collaboration with the Centre for Interdisciplinary Addiction Research (ZIS).
Care pathways of people with alcohol dependence in Germany. The project examines treatment trajectories by linking routine data with outpatient addiction service data.
My cryptographic implementation: Design and implementation of a cryptographic data linkage pipeline and project-specific software for securely integrating data from different institutions and payers.
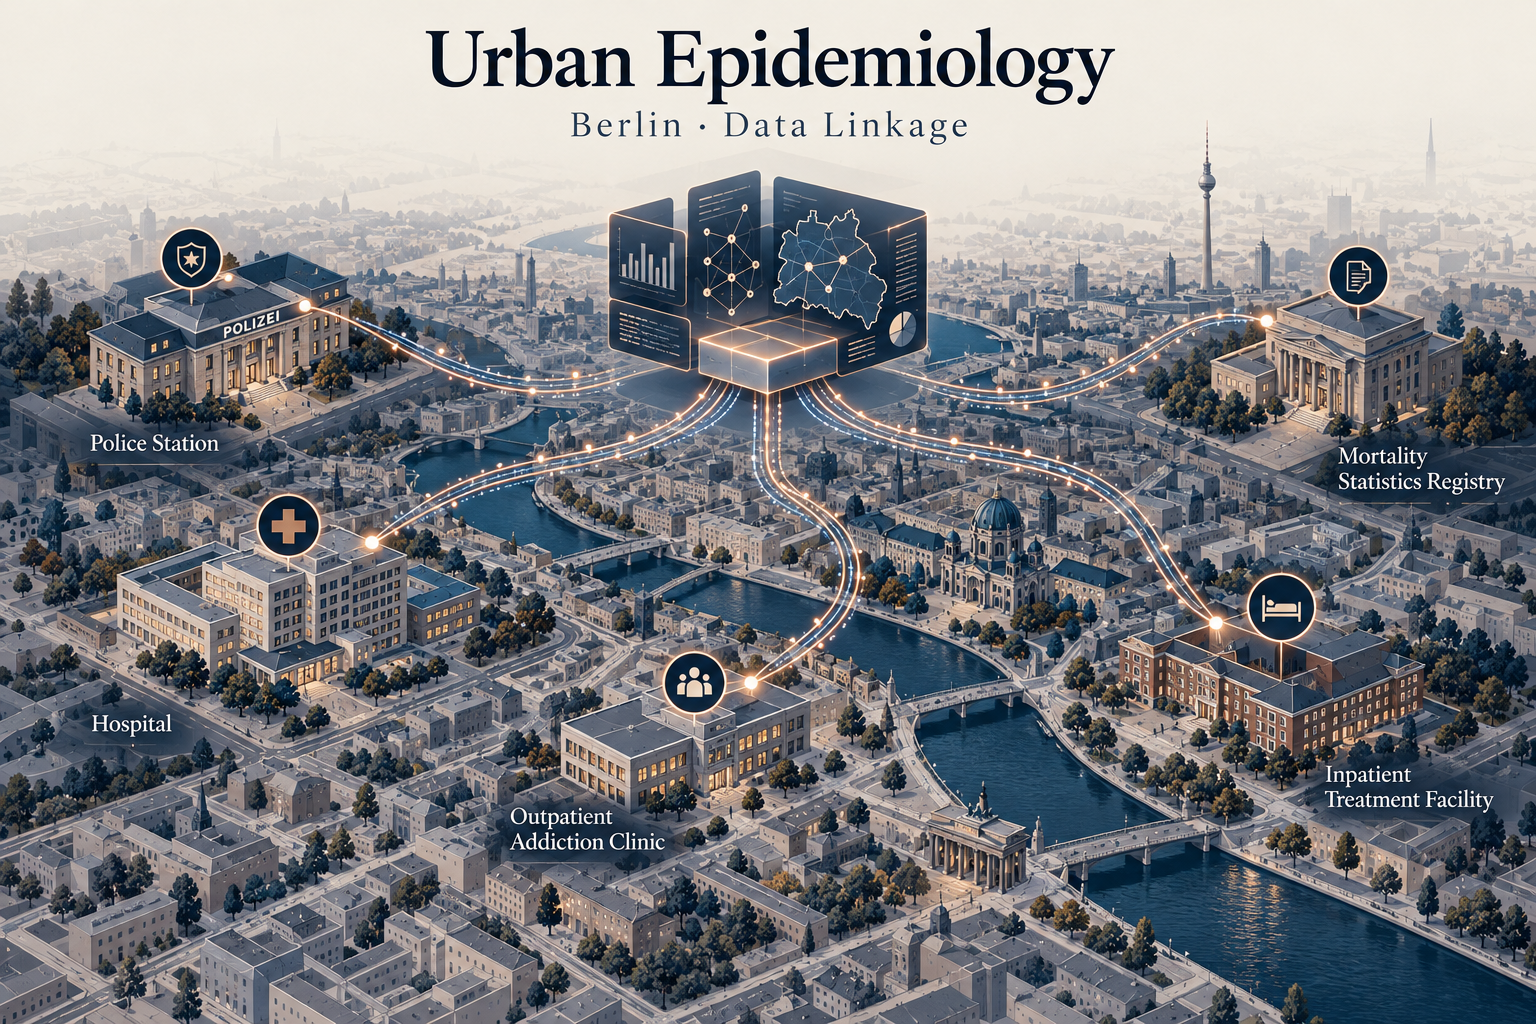
Urban epidemiology: data linkage & capture–recapture in Berlin
Estimating the prevalence of substance-related disorders by linking five administrative data sources: hospital, crime, outpatient and inpatient addiction services, and drug-related death statistics.
My cryptographic implementation: Development of a web-based encryption solution for data linkage and contributions to statistical capture–recapture analysis for estimating incompletely observed populations.
Automated facial expression classifications were compared with human ratings in 389 psychotherapy sessions involving 23 patients. The study shows how video data can support psychological research.
Clinical proof of concept; not a validated method for employment decisions.
Steppan, M., Zimmermann, R., Fürer, L., et al. (2024). Machine Learning Facial Emotion Classifiers in Psychotherapy Research: A Proof-of-Concept Study. Psychopathology, 57(3), 159–168.
Google search volumes as a complementary data source
The study compares Google search volume indices with survey data on cannabis use, examining the comparability of prevalence estimates across countries and regions.
Search volumes alone are too weak a basis for prevalence estimates. Combining them with other sources is essential.
Steppan, M., Kraus, L., Piontek, D., & Siciliano, V. (2013). Are cannabis prevalence estimates comparable across countries and regions? A cross-cultural validation using search engine query data. International Journal of Drug Policy, 24(1), 23–29.
This European study examines heart rate, heart rate variability and other autonomic measures alongside behavioural dimensions, combining physiological data with multivariate analysis and adjustment for relevant covariates.
The examined associations disappeared after adjustment for covariates. Physiological signals do not allow simple inferences about behaviour.
Prätzlich, M., Oldenhof, H., Steppan, M., et al. (2019). Resting autonomic nervous system activity is unrelated to antisocial behaviour dimensions in adolescents: Cross-sectional findings from a European multi-centre study. Journal of Criminal Justice, 65, 101536.
The Berlin study linked five administrative data sources: hospital, crime, outpatient and inpatient addiction services, and drug-related death statistics. Encrypted identifiers and capture–recapture models enabled estimation of incompletely observed populations.
The estimates depend on data quality, record matching and model assumptions. The research report describes these methods and their limitations.
Kraus, L., Steppan, M., & Piontek, D. (2015). Estimating the prevalence of substance-related disorders in Berlin: opioids, cocaine and stimulants. IFT Institute for Therapy Research.
Automated speaker identification: Our random forest study describes a method for identifying who speaks when in an audio recording. It was evaluated on a synthetic speech corpus, and the code was made publicly available. Fürer, Schenk, Roth, Steppan et al. (2020), Frontiers in Psychology.
How are people, teams and organisations connected? I analyse social networks with Gephi, exploring collaboration, information flows, group structures and the people who connect them.
From planning a network survey and preparing relational data to metrics, visualisation and presentation of findings. Methodological background: my further training in Social and Economic Networks: Models and Analysis at Stanford University.
Illustrative network: scattered points form two groups in blue and orange. Points represent actors and lines their relationships; the data are illustrative.
BIOLOGICALLY INSPIRED AI · ANT COLONY OPTIMIZATION
From ant colonies to efficient assessment.
We also use AI and optimisation methods inspired by biological principles. In Ant Colony Optimization virtual ants explore possible solutions. Successful selections receive more pheromone; this trail influences subsequent search steps and fades over time.
In psychometrics, this approach can identify suitable items for a shorter questionnaire. Our LoPF-Q study (2022) uses this approach to select items based on model fit, reliability and clinical validity.
Blue pheromone trailOrange pheromone trailVirtual ants
Simplified simulation using illustrative data: one item is selected per dimension. Blue and orange show the trails of two search groups. This is not a display of study results.
Which question would you like to explore?
Describe your question, available data and intended timeframe. Together we can clarify requirements, approach and project scope.